Cosmic Rays on a Transatlantic Flight
Earth’s atmosphere is a shield, protecting us from the radiation of space. At 6 km altitude, more than half of the atmosphere’s mass now sits below you and radiation levels are five times higher than what they are at sea level. Recently, 10 km up on an international flight, I had a Radiacode 103 in my carry on. The Radiacode is a pocket-sized scintillation counter capable of basic gamma-ray spectroscopy and logging. Coupled with a bluetooth connection to your phone, you can record spectrogram data over time and take position-correlated measurements with GPS location. I have brought it on plenty of trips before, but this is by far the longest journey by plane it has been on with some nice opportunities for experimentation.
While still in the airport, I began collecting data in “spectrogram” mode within the associated app. I had a few false starts with data getting overwritten on the first leg of my trip (choose the option “Save & Start New” for “Time Limit” to avoid data loss in the future). However, I eventually got things working for my last and longest flight from Europe to the USA. Data saved successfully to my phone and I was able to export a JSON file containing the data.
There doesn’t seem to be much documentation on the spectrogram file format, but it was clear from the keys what everything meant. I received a list of spectra each containing the counts within each energy bin of the sensor and the time period over which the measurement was collected. This was enough for me to calculate the count rate and with a roughly 10 minute moving average gave the blue curve in the plot below. Overlaid in orange, I have gone to FlightAware and pulled its records of ADS-B data containing the altitude of my flight. In theory, you can get a dose rate with the binned energies and calibration curves for the detector, but I leave this as a project for a later day. I would like to learn if you can get logged dose rates directly from the Radiacode in the future.
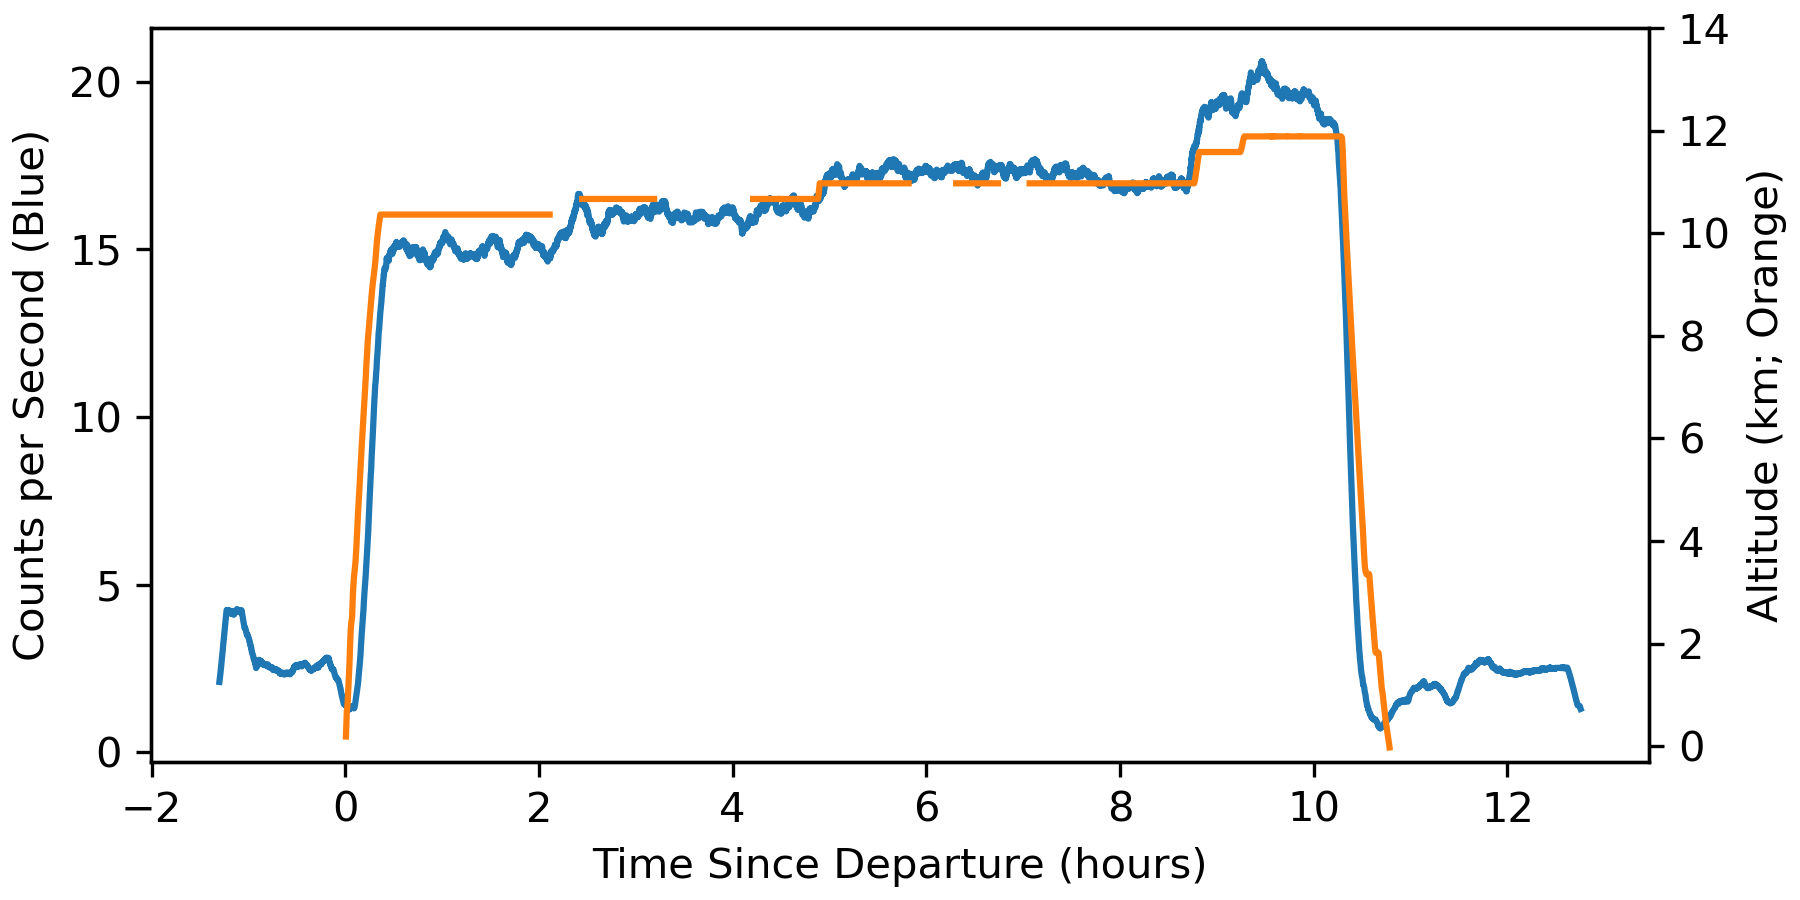
The count rate clearly steps up with increases in altitude. There is also a dip in the radiation level at very low altitudes on takeoff and landing compared to the background level sitting on the ground. I assume this is due to us leaving behind terrestrial sources of radiation as we take off. Their contribution to count rate decreases as we get further away and atmospheric sources of radiation are still well shielded by the atmosphere this far down. I don’t have good data for this and the takeoff period is too short to collect good spectra, though.
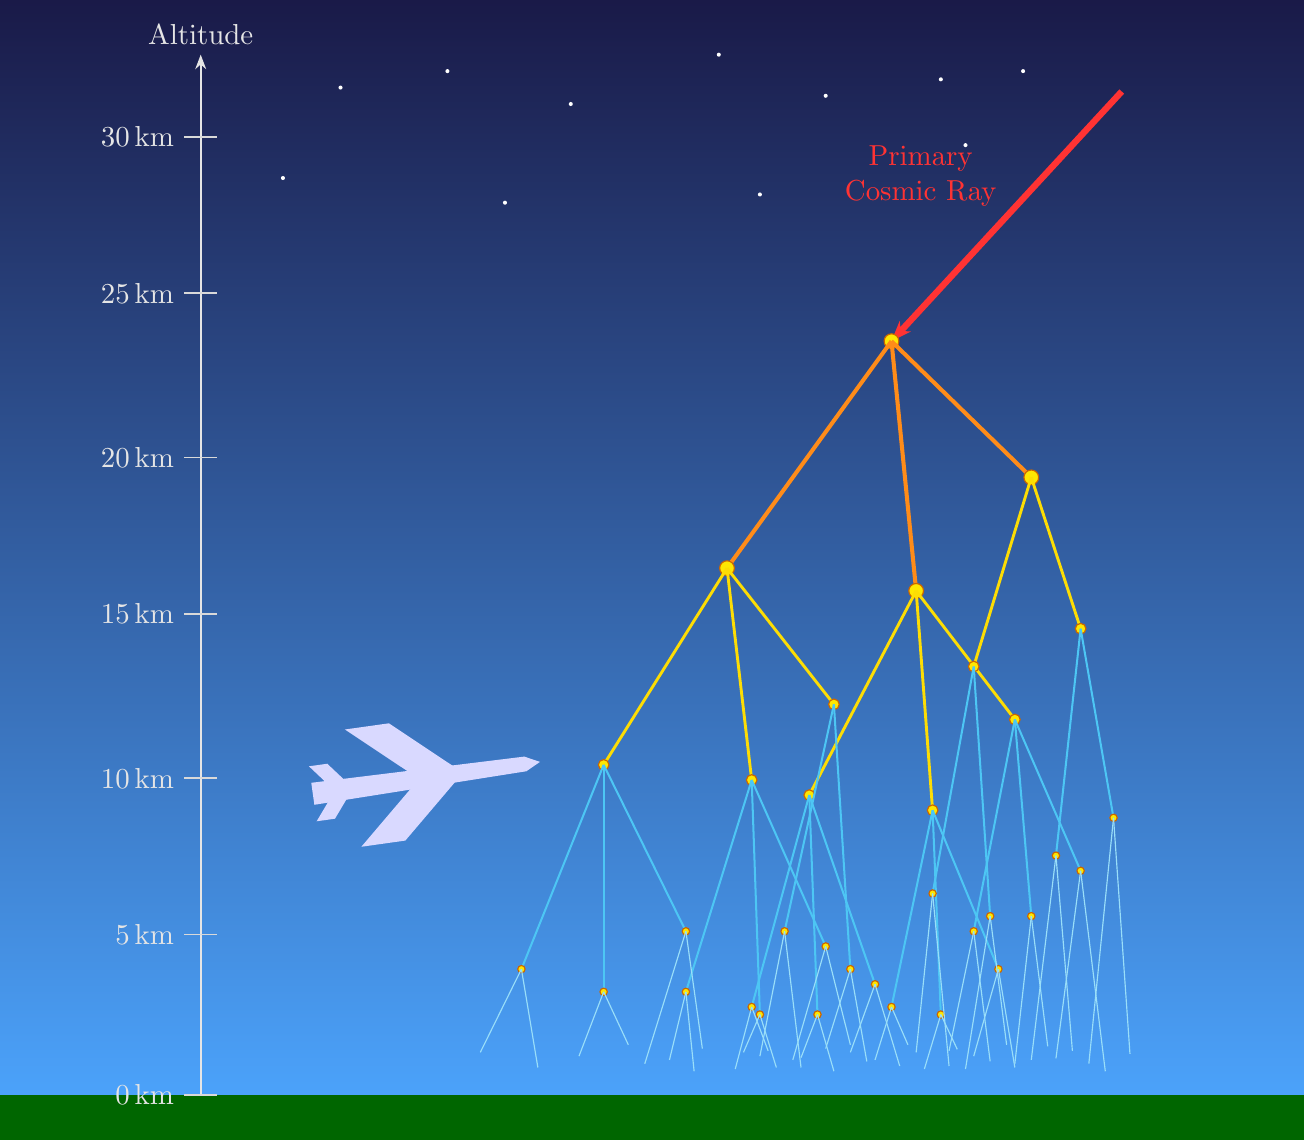
Radiation at altitude mostly comes from cosmic rays. Primary cosmic rays strike the upper atmosphere sending down a shower of radiation which travels through the atmosphere until it is eventually detected by me in the plane. As we get higher, there is less atmosphere to shield me from the point where the secondary particles are being made. High in the atmosphere, we will also see the rate of secondary production decrease. Eventually, if you go high enough you will reach a maximum in the region of the atmosphere where the secondaries are being produced as the decrease in shielding isn’t enough to make up for the decrease in rate of secondary production (Regener-Pfotzer maximum).
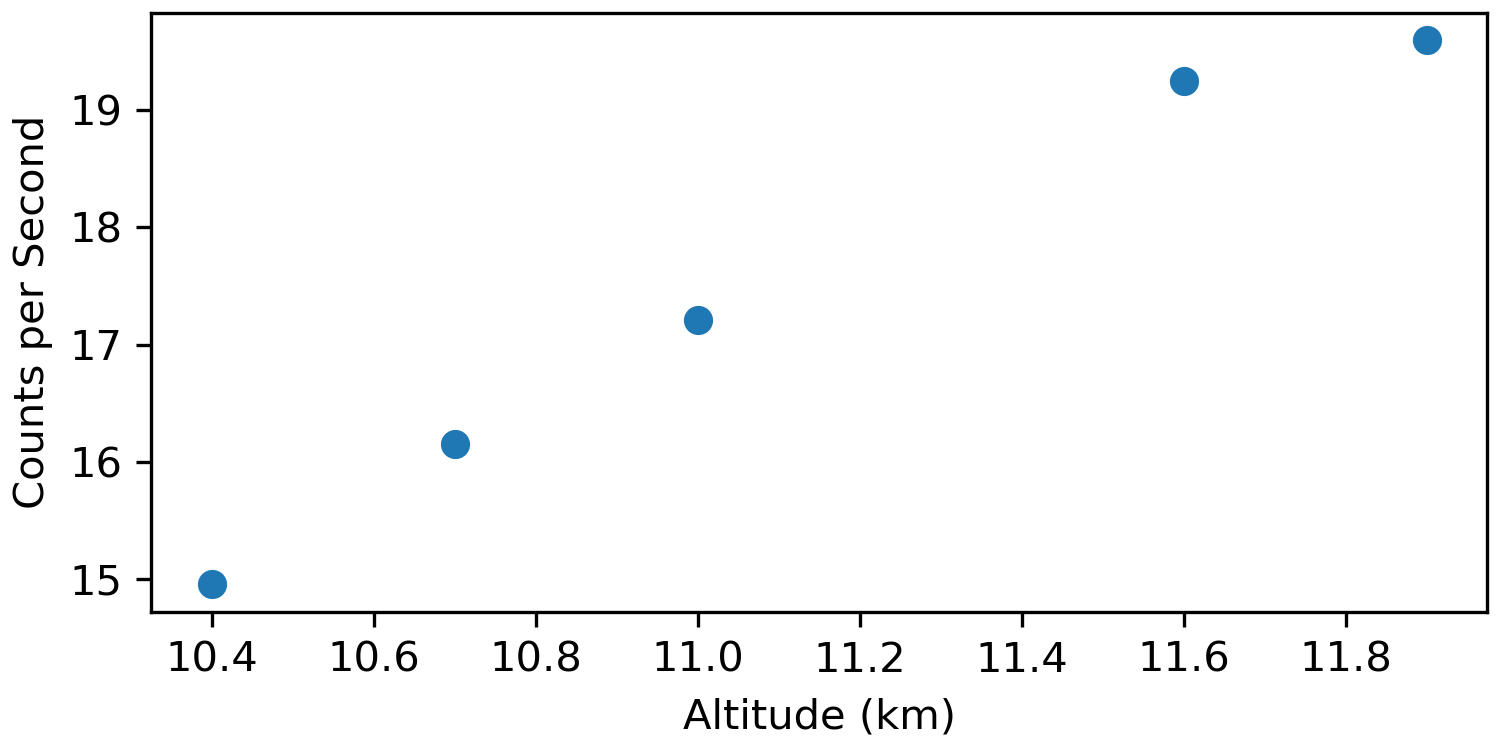
I calculated the altitude dependence of the count rate. Outside of the datapoint at 11.9 km, the dependence looks very linear. This datapoint was collected over a short period of time and you can see that the count rate in the first plot trends downwards at the end of the short period at this altitude. Maybe there is some altitude reporting issue here as the plane prepares for landing or an atmospheric condition affecting the measurement?
I also looked at the energy spectrum of the radiation as the height varied and noticed no changes between the altitudes I observed on the plane. In the figure below, the spectra at each altitude normalized to a max count rate of one count per second is shown. An additional sea level spectrum which I took earlier in San Francisco is shown in black. The main difference when going to altitude seems to be a new low energy peak <100 keV. Possibly fluorescence? I would love to hear if anyone has suggestions for what this is.
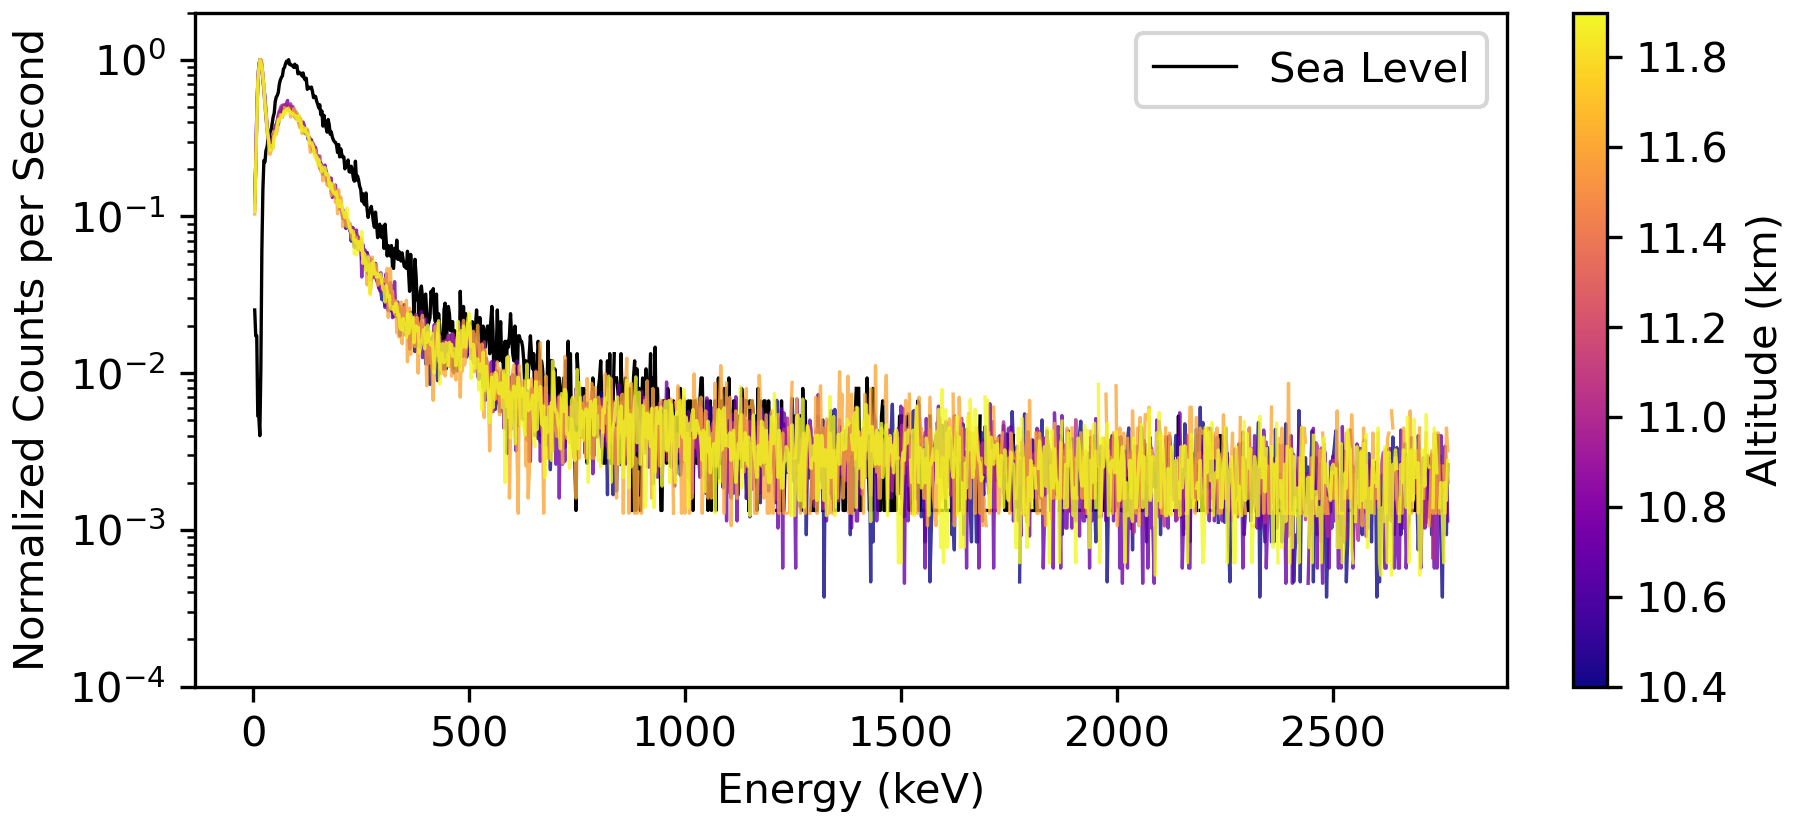
For the “at altitude” measurements, I was expecting some shift to the right as we go up and see more primary cosmic rays as opposed to secondaries. However, we may just not be high enough in the atmosphere for this effect. As a side note: you can clearly see the electron annihilation peak at 511 keV in this plot.
Overall, I was able to see some dependence of count rate on altitude. Planes unfortunately (or perhaps fortunately for my health) fly much lower than the Regener-Pfotzer maximum at roughly 20 km, making the dependence simple. I did learn more about the dependence of count rate on altitude which ended up being more complicated than expected. I plan to keep taking my little scintillation counter on trips in the future. Perhaps a journey through the San Francisco Transbay Tube or survey hike through city neighborhoods connected to nuclear history is warranted.